Charts
Charts provides visual dashboards for trend analysis and quick comparison of sales activity.
What the feature does
- Displays sales trends in chart format
- Helps compare time periods and performance
- Gives a quick visual alternative to tabular reports
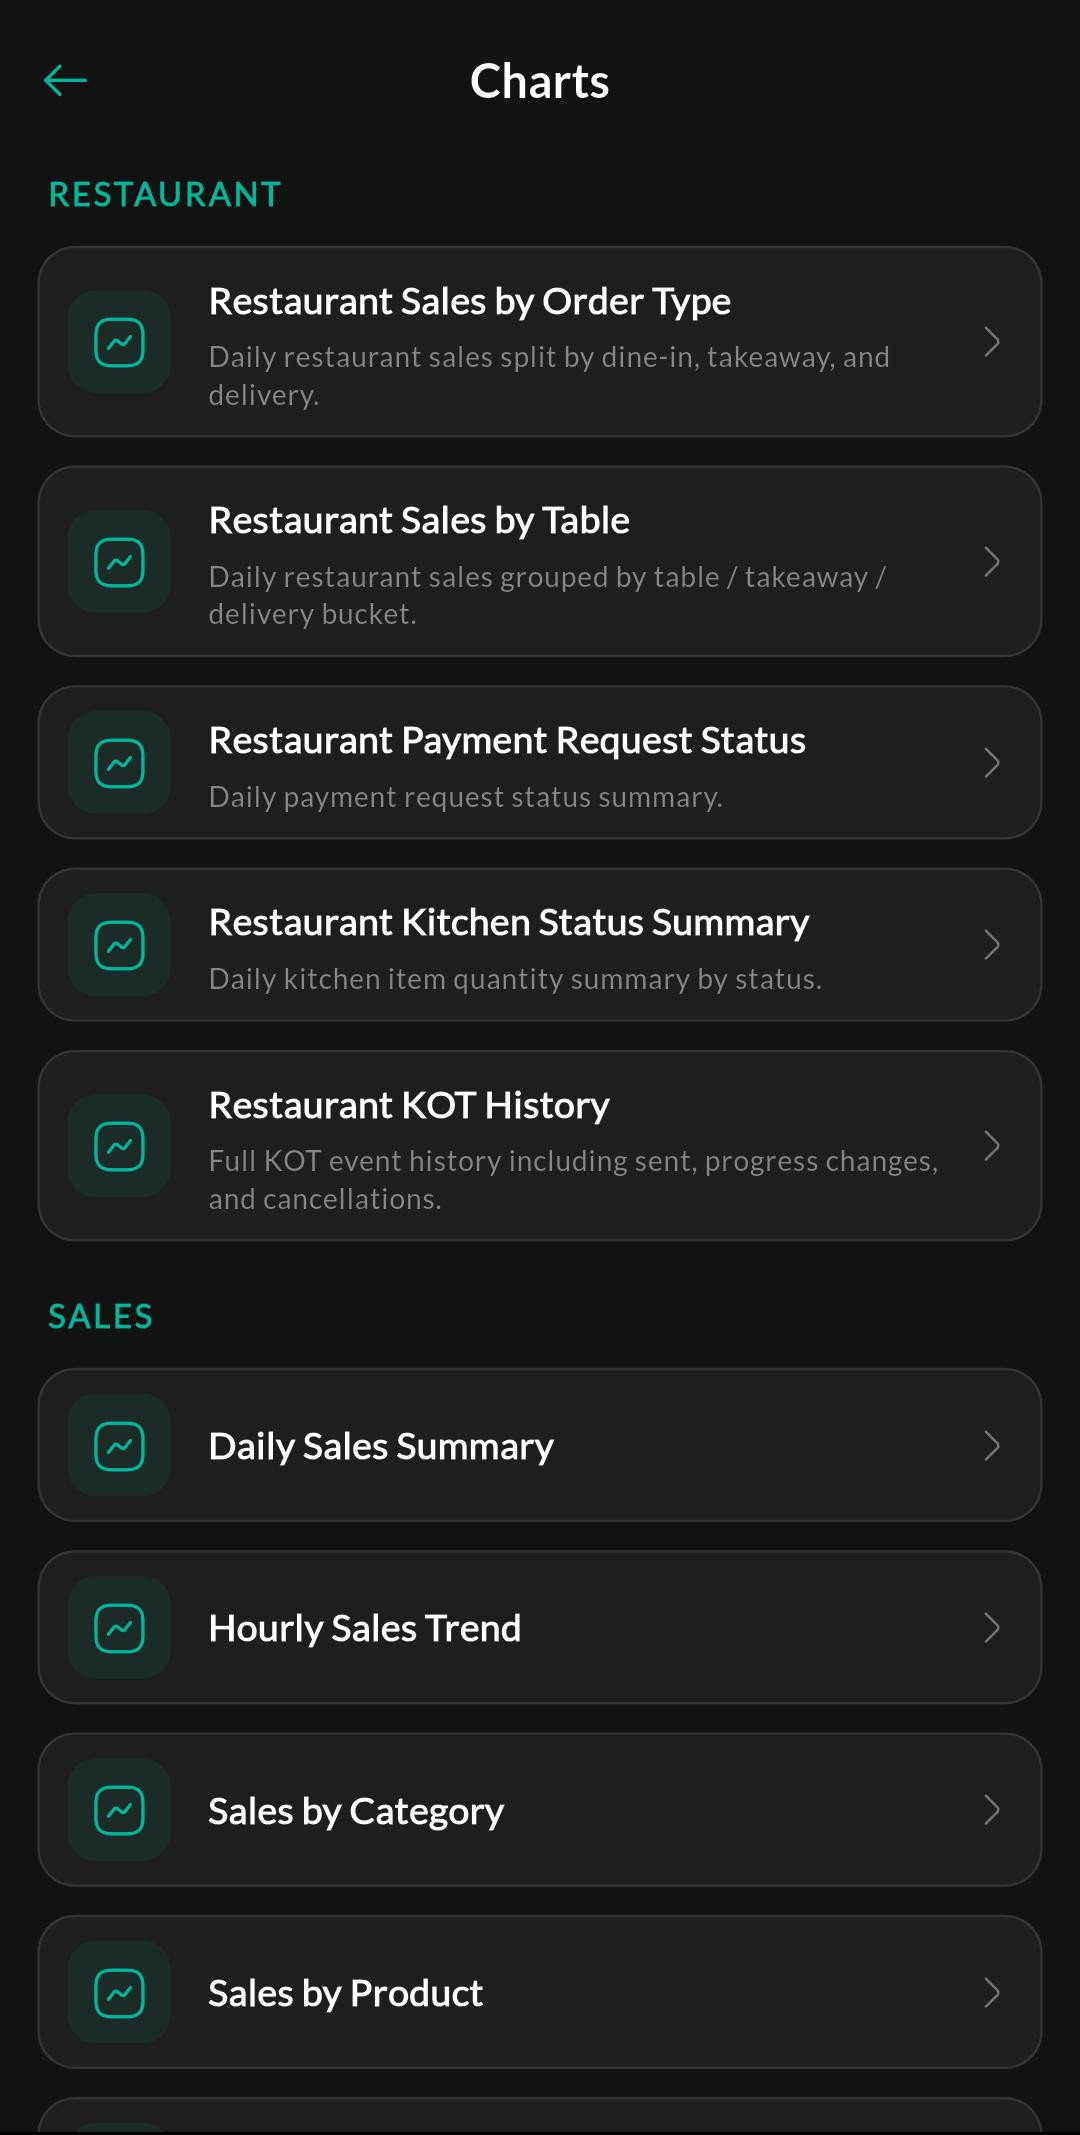
Screen: Charts
Purpose
View chart dashboards and switch between metrics and date ranges.
Related settings
Troubleshooting
Chart data looks wrong
Check the selected date range and make sure you are comparing the same report period in both charts and reports.